Product insights gives you a central view of course and learning program performance. You can review course activity data, compare learning program metrics, and use the available reports to understand how learners interact with your content.
From your Admin Dashboard, go to Reports → Product insights. The page includes three tabs: Analytics, All courses, and All learning programs.
Review course activity metrics
Use the All courses tab to open a course and review how learners interact with its activities.
1. Navigate to Reports→ Products Insights or to the course insight tab inside any course of your choice.
2. Select All Courses.
3. Select any course from the list.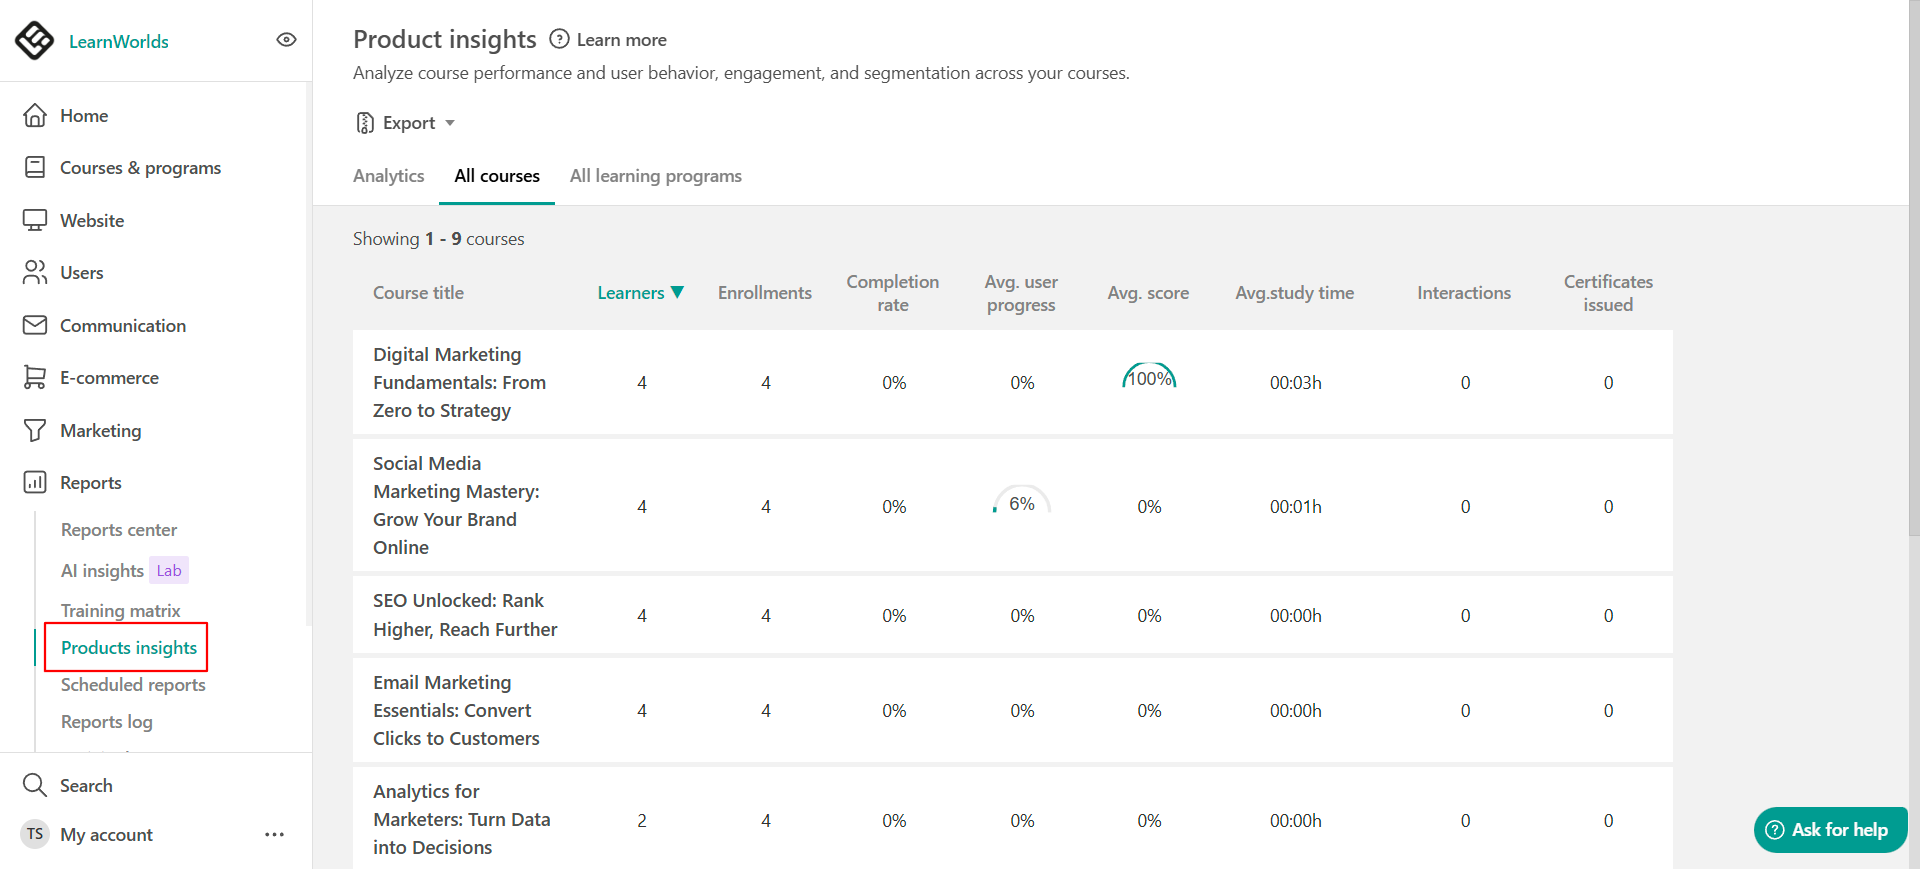
4. Select the Activities Metrics tab.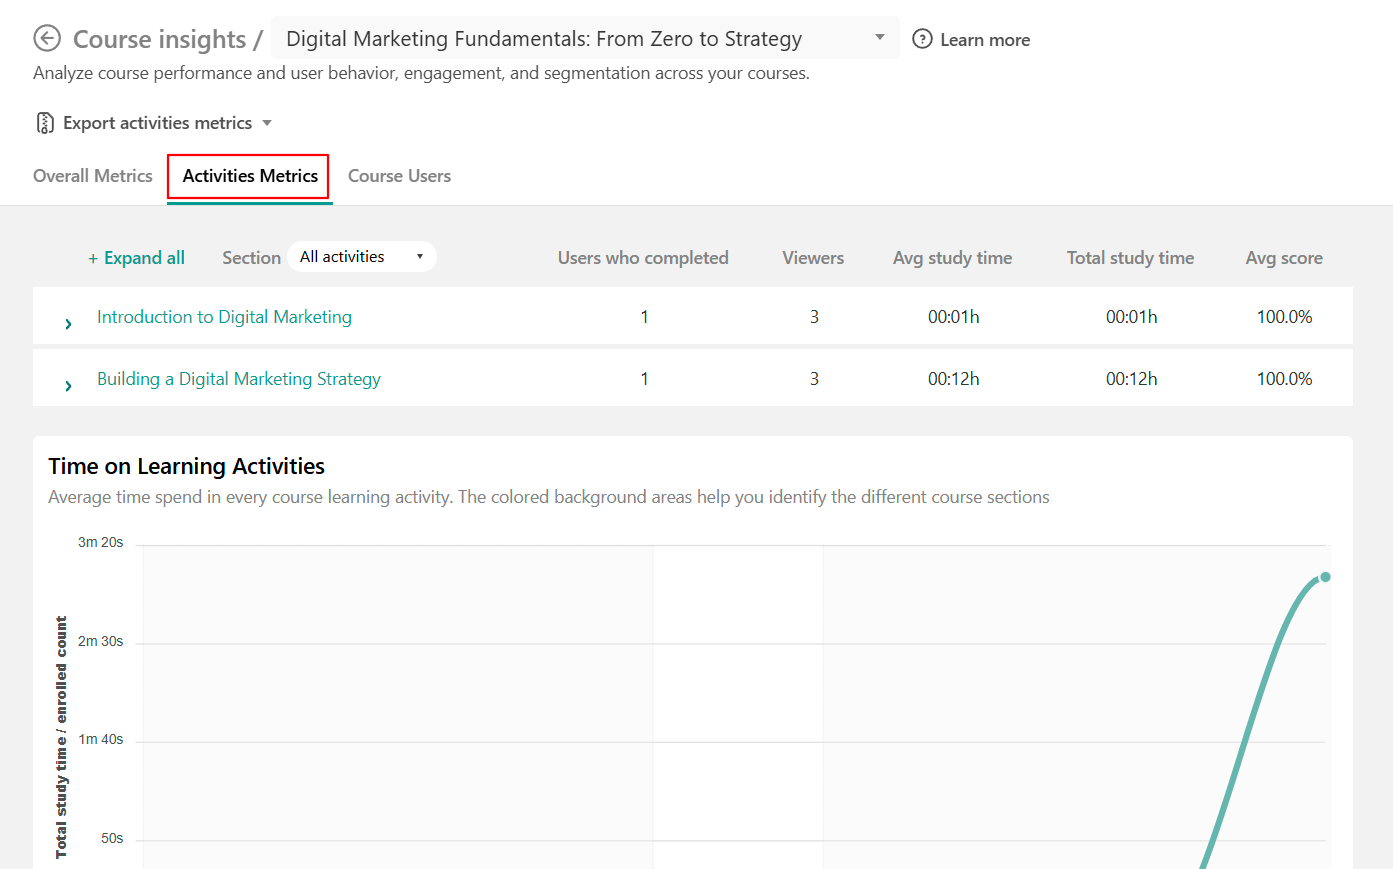
At the top, you can see a high-level overview of the user engagement statistics for each course section.
The metrics available are:
- Users who completed (all activities of the section)
- Viewers (that viewed but not necessarily completed all activities)
- Average study time
- Total study time
- Average score
Select the arrow next to a section to expand it and view the activities it contains. The corresponding metrics are then shown for each activity.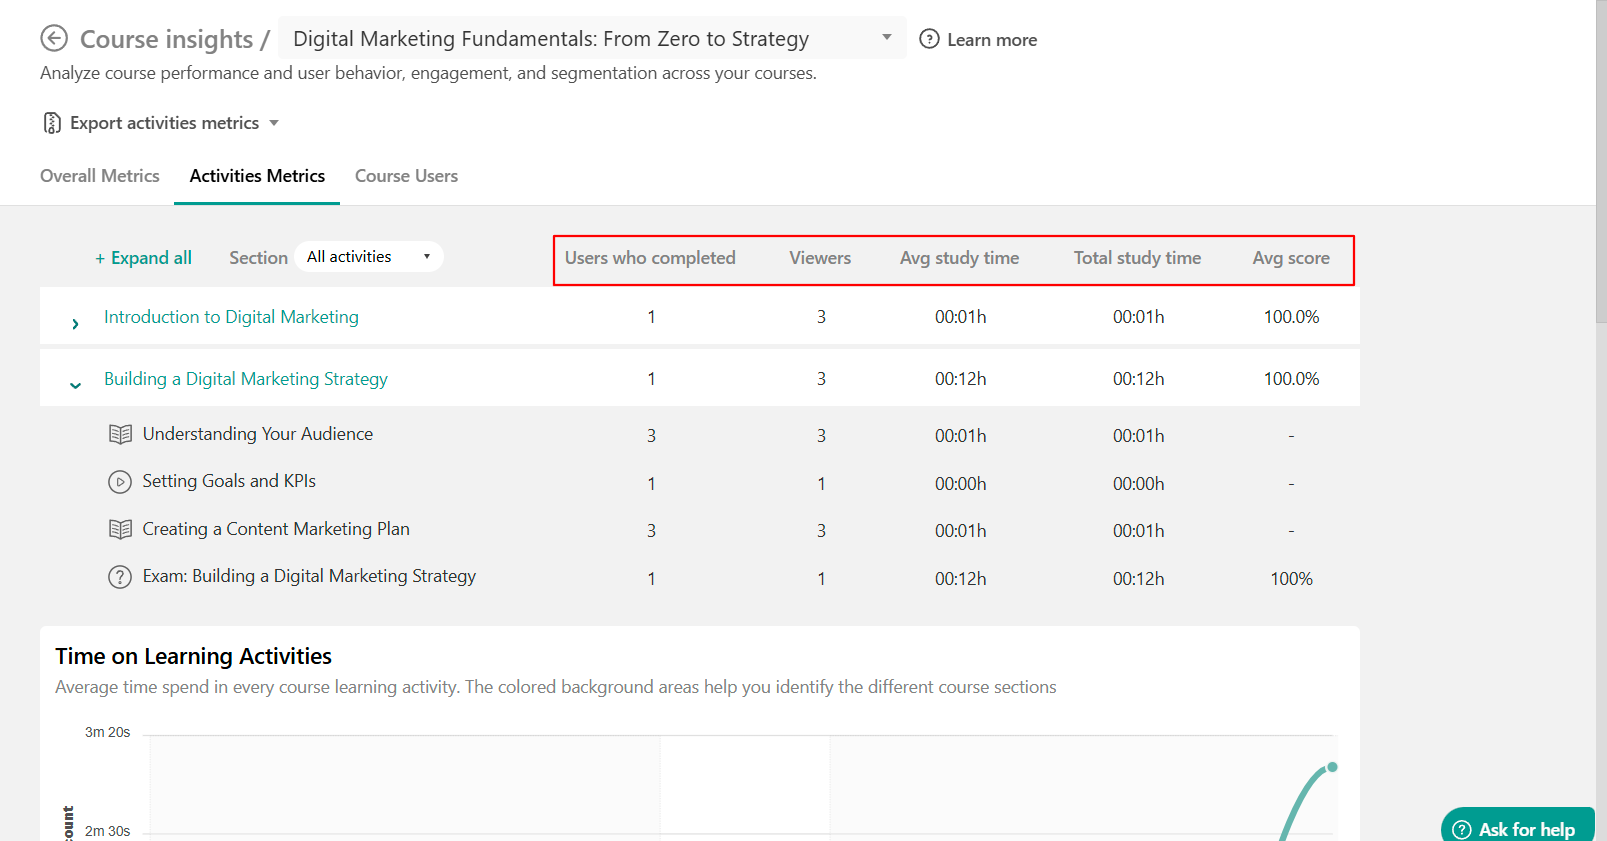
You can also select only the exact activity type you wish to be displayed from the drop-down filter list:

In the specific case of a Video learning activity, you can further view user engagement for that video by clicking on the stats button shown below (only for videos uploaded in the LearnWorlds Video Library).

The same data on all activities can be extracted in either .csv or .xls format from the Export all activities option on the top right of the page.
Review learning program metrics
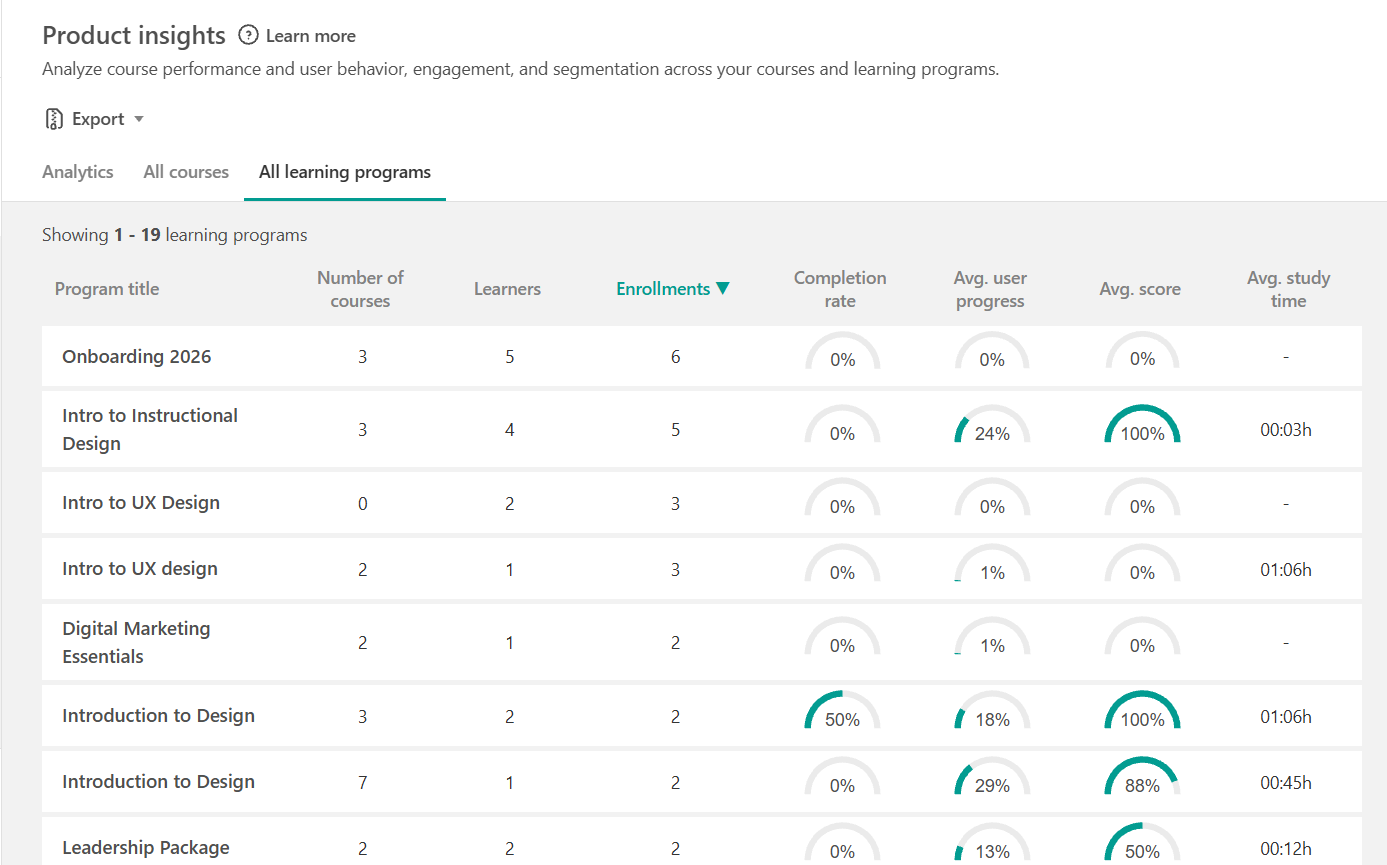
Use the All learning programs tab to compare performance across your learning programs.
Go to Reports → Product insights → All learning programs. The table shows each learning program together with the following metrics:
- Number of courses, showing how many courses are included in the learning program
- Learners, showing the number of learners associated with the learning program
- Enrollments, showing the number of enrollments recorded for the learning program
- Completion rate, showing the percentage of learners who completed the learning program
- Average user progress, showing the average progress recorded across learners in the learning program
- Average score, showing the average score recorded for learners in the learning program
- Average study time, showing the average time learners have spent in the learning program
You can use these metrics to compare participation and progress across learning programs and identify programs that may need a closer review.